Why Power Consumption Matters
Before diving into formulas, let me share three reasons power calculations are so important:- Budget Forecasting: Energy usage directly impacts operating expenses. For instance, a 10 kW video wall running 8 hours a day consumes 80 kWh daily. At $0.12 per kWh, that’s $9.60 per day—or over $288/month. Accurate estimates help you avoid sticker shock.
- Infrastructure Planning: Large LED installations demand properly rated circuits, breakers, and sometimes backup power systems. Underestimating draw can lead to tripped breakers or equipment failure—issues nobody wants on show day.
- Sustainability Goals: As more organizations aim to reduce their carbon footprint, optimizing power use becomes part of responsible event management and facility design.
Key Concepts & Definitions
Here are the core terms I reference on every project:- Screen Area (A) The total display size in square meters (width × height).
- Power Density (D) Manufacturer’s spec in watts per square meter (W/m²). Reflects how much power each square meter of panel draws at full brightness.
- Brightness Factor (B) A percentage (0–100 %) representing how brightly you actually run the display relative to its maximum. Most events use 50–75 % to balance visibility and power.
- Operating Hours (H) Average hours per day the display is on.
- Electricity Rate (R) Your local cost per kilowatt-hour (e.g., $0.12/kWh).
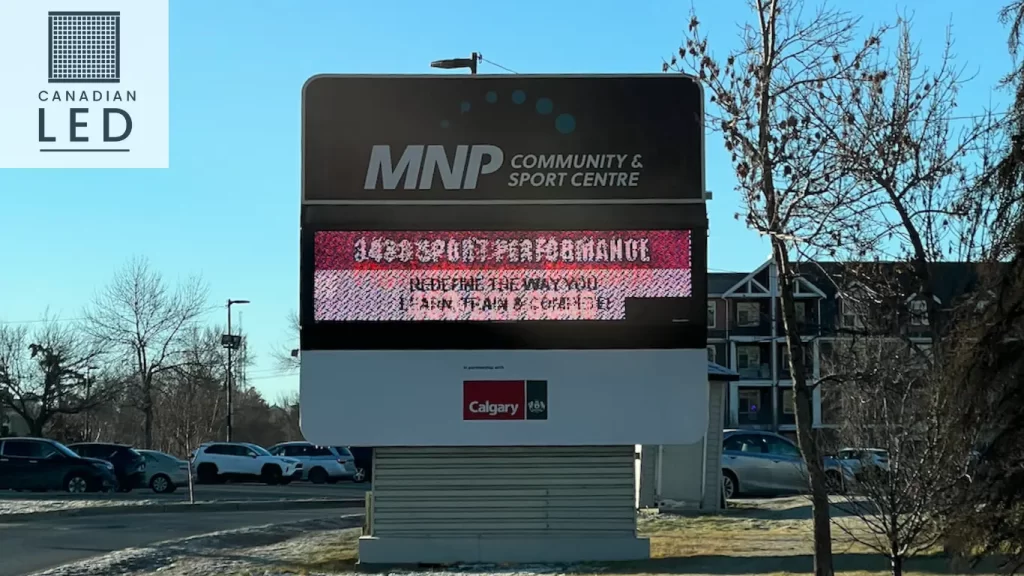
High-brightness outdoor LED display installed by Canadian LED at Calgary’s MNP Community & Sport Centre to enhance public communication.
The Core Calculation Formula
To estimate your instantaneous power draw (in watts), use this: Power Draw (W) = A (m²) × D (W/m²) × (B / 100) To convert that into daily energy use (kWh) and cost: Daily Energy (kWh/day) = Power Draw (W) × H (hours) ÷ 1,000 Daily Cost ($) = Daily Energy (kWh) × R ($/kWh)Seeing It in Action: YouTube Demo
For those who prefer visuals, I’ve created a short walkthrough showing these calculations step-by-step: ▶️ Watch the demo ▶️How to Calculate LED Display Power ConsumptionWorked Examples
Let’s apply the formula to two common scenarios I encounter.Example 1: Small Indoor Video Wall
- Dimensions: 3 m (W) × 2 m (H) = 6 m²
- Power Density: 400 W/m² (typical for indoor panels)
- Brightness Factor: 50 % (0.5)
- Operating Hours: 10 h/day
- Electricity Rate: $0.12/kWh
- Power Draw: 6 m² × 400 W/m² × 0.5 = 1,200 W
- Daily Energy: 1,200 W × 10 h ÷ 1,000 = 12 kWh/day
- Daily Cost: 12 kWh × $0.12 = $1.44/day
Example 2: Large Outdoor LED Wall
- Dimensions: 6 m × 4 m = 24 m²
- Power Density: 600 W/m² (for high-brightness outdoor panels)
- Brightness Factor: 75 % (0.75)
- Operating Hours: 12 h/day
- Electricity Rate: $0.12/kWh
- Power Draw: 24 m² × 600 W/m² × 0.75 = 10,800 W
- Daily Energy: 10,800 W × 12 h ÷ 1,000 = 129.6 kWh/day
- Daily Cost: 129.6 kWh × $0.12 = $15.55/day
Factors That Influence Real-World Consumption
While our formula gives a solid baseline, here are real-world factors I’ve learned to account for:- Ambient Temperature & Ventilation: In hot environments, driver fans or cooling systems may run more, slightly increasing draw.
- Local Dimming & Zone Control: Advanced controllers can dim unused zones—which, for static content, cuts average power by up to 30 %.
- Content Type: Bright, full-screen videos use more power than darker slides or logos.
- Panel Technology Variants: SMD vs. COB vs. “black-face” LEDs each have unique efficiencies.
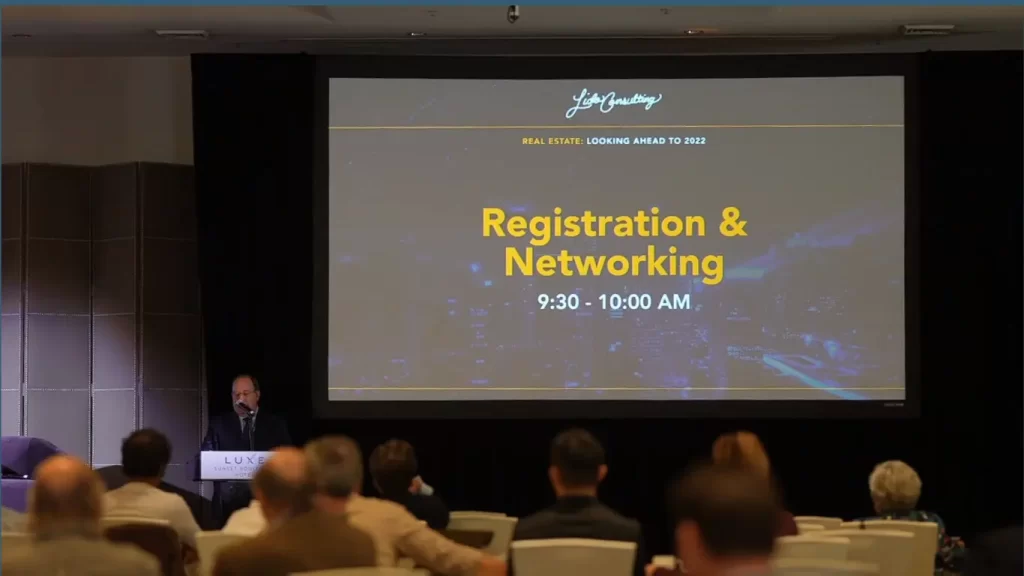
A high-resolution LED display from Canadian LED enhances the experience at a real estate networking event, clearly presenting the registration schedule.
Tips to Optimize Energy Use
Over the years, I’ve picked up some tricks to help clients reduce energy costs without sacrificing quality:- Brightness Scheduling: Program daytime (higher) and nighttime (lower) brightness profiles automatically.
- Zone-Based Dimming: Dim sections of the wall showing black or low-brightness content—especially effective in theaters or houses of worship.
- Routine Maintenance: Keep modules clean and ensure unobstructed airflow. Dusty heatsinks and clogged filters can boost power draw.
- Efficient Power Supplies: Choose drivers rated above 90 % efficiency to minimize energy loss.
- Content Guidelines: Encourage designers to use darker backgrounds when possible—simple color tweaks can yield noticeable savings.
Budgeting & ROI Considerations
When planning your LED display investment, it’s not just the purchase price—power consumption affects your total cost of ownership:| Scenario | Daily kWh | Daily Cost | Monthly Cost | Annual Cost |
| Small Indoor Wall (6 m², 50 %) | 12 kWh | $1.44 | $43.20 | $518.40 |
| Large Outdoor Wall (24 m², 75 %) | 129.6 kWh | $15.55 | $466.50 | $5,598.00 |
| After Zone Dimming (~30 %) | — | — | –$140.00 | –$1,680.00 |
Real-World Case Study
A few months ago, we outfitted a large sanctuary with led screens for churches in Calgary. By implementing brightness profiles—full brightness during sermon visuals, dimmed between songs—we slashed their monthly power bill from $360 to $270 without compromising worship experience. Small tweaks, big impact!
Conclusion & Next Steps
Calculating your LED display’s power consumption doesn’t have to be guesswork. By following these steps, you can:- Accurately estimate energy use and budget accordingly.
- Plan your electrical infrastructure—from breakers to backup systems.
- Optimize for efficiency with smart scheduling, zone dimming, and proper maintenance.